Products You May Like
A large-scale unauthenticated scraping of publicly available and non-secured endpoints from older versions of Prometheus event monitoring and alerting solution could be leveraged to inadvertently leak sensitive information, according to the latest research.
“Due to the fact that authentication and encryption support is relatively new, many organizations that use Prometheus haven’t yet enabled these features and thus many Prometheus endpoints are completely exposed to the Internet (e.g. endpoints that run earlier versions), leaking metric and label dat,” JFrog researchers Andrey Polkovnychenko and Shachar Menashe said in a report.
Prometheus is an open-source system monitoring and alerting toolkit used to collect and process metrics from different endpoints, alongside enabling easy observation of software metrics such as memory usage, network usage, and software-specific defined metrics, such as the number of failed logins to a web application. Support for Transport Layer Security (TLS) and basic authentication was introduced with version 2.24.0 released on January 6, 2021.
The findings come from a systematic sweep of publicly-exposed Prometheus endpoints, which were accessible on the Internet without requiring any authentication, with the metrics found exposing software versions and host names, which the researchers said could be weaponized by attackers to conduct reconnaissance of a target environment before exploiting a particular server or for post-exploitation techniques like lateral movement.
Some of the endpoints and the information disclosed are as follows –
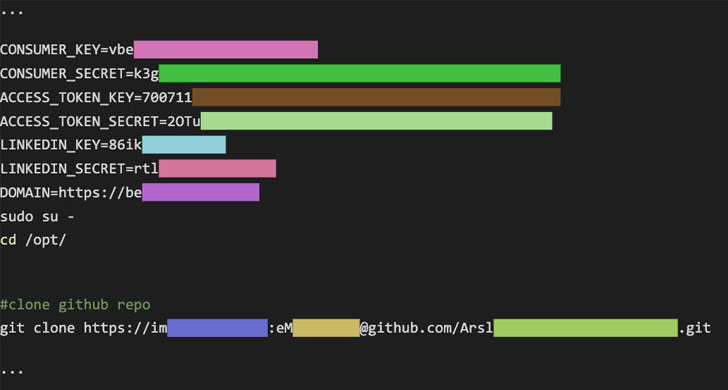
- /api/v1/status/config – Leakage of usernames and passwords provided in URL strings from the loaded YAML configuration file
- /api/v1/targets – Leakage of metadata labels, including environment variables as well as user and machine names, added to target machine addresses
- /api/v1/status/flags – Leakage of usernames when providing a full path to the YAML configuration file
Even more concerningly, an attacker can use the “/api/v1/status/flags” endpoint to query the status of two administration interfaces — “web.enable-admin-api” and “web.enable-lifecycle” — and if found manually enabled, exploit them to delete all saved metrics and worse, shut down the monitoring server. It’s worth noting the two endpoints are disabled by default for security reasons as of Prometheus 2.0.
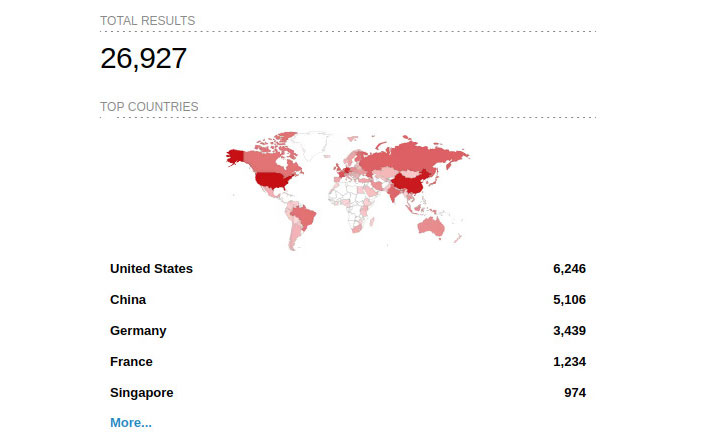
JFrog said it found about 15% of the Internet-facing Prometheus endpoints had the API management setting enabled, and 4% had database management turned on. A total of around 27,000 hosts have been identified via a search on IoT search engine Shodan.
Besides recommending organizations to “query the endpoints […] to help verify if sensitive data may have been exposed,” the researchers noted that “advanced users requiring stronger authentication or encryption than what’s provided by Prometheus, can also set up a separate network entity to handle the security layer.”


